Visual Grammar
One visual language (Imagism) and token specification extending Wilkinson's Grammar of Graphics from R/ggplot2 charts to documents, slide decks, and web UI, paired with a 97-term part lexicon.
Visual Grammar is built around a personal style specification and a set of composition rules. It carries the same choices about color, type, spacing, and emphasis across R plots, documents, decks, and web interfaces. This site uses it.
Formats
| Part | What it handles |
|---|---|
| niu-graph | R/ggplot2 figures, direct labels, and themes |
| Document language | Analytical briefs, reports, tables, and exhibits |
| UI blocks | Shared HTML/CSS structures for websites and wireframes |
| Anatomy | Names and code handles for precise review |
Theme modules let a client deliverable use a different palette without rebuilding the chart or layout.
Reducing style to a skeleton
The system names 97 chart, document, and interface parts, each tied to its code selector. Each component has a style template that any agent can use to build plots, generate decks, and structure a document the way I would manually.
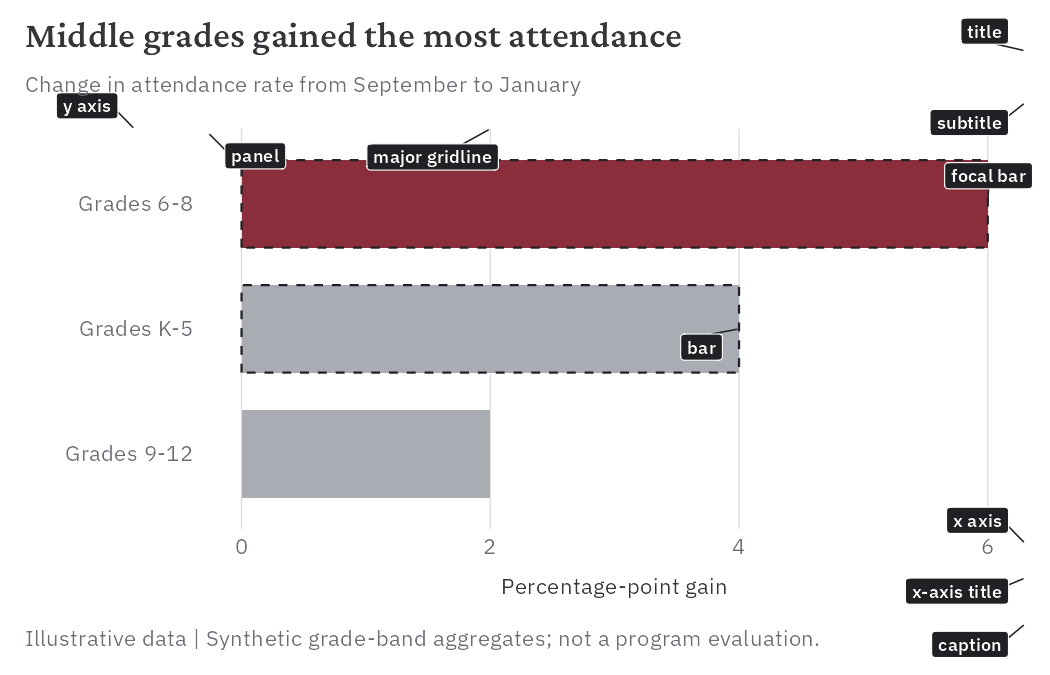
imagism plot from niu-graph with its anatomy labels overlaid: a Crimson Pro assertion title, a single cranberry focal bar (#8A2E3B) against muted slate comparison bars, hairline rules, and named handles for every part.